
UPDATED: 9:00 p.m., Oct. 14: Airbnb and other short-term rental services straddle a fine line between the so-called ‘sharing economy,’ characterized by collaborative peer relationships, and ‘the economy’ proper, the realm of shrewd, profit-seeking enterprises.
While most “hosts” on these platforms rent their apartments ‘casually’ — “to make extra money and meet cool people,” as Airbnb CEO Brian Chesky told Stephen Colbert last week — a sizable minority use them to run de facto hotels, earning substantial income, an analysis by The Real Deal of data scraped from Airbnb’s website found.
These business-minded hosts are, in effect, exacerbating the city’s already-acute rental housing shortage, taking hundreds of rental units off the market in some of the city’s hottest neighborhoods and putting upward pressure on rents.
The San Francisco-based Airbnb, valued at $25.5 billion, is by far the largest home-sharing platform, a group that includes Homeaway, Flipkey, onefinestay and others. Airbnb boasts over a million listings in 34,000 cities, and according to data from Inside Airbnb, a independent data analysis website, listed about 27,000 apartments in New York as of July 1.
Airbnb declined multiple requests for an interview for this story. But in a statement after the story was published, the company questioned its methodology and challenged its findings.
In a report on Airbnb’s impact on New York City last year, the New York Attorney General’s Office designated Airbnb listings of whole units and private rooms as “commercial” if they were rented through the service at least half the year, 182 days, or more.
By that standard, the citywide total of commercial units on Airbnb stands at around 2,400-4,600 units, roughly 8 to 17 percent of all listings, according to TRD estimates (more on how we got there below).
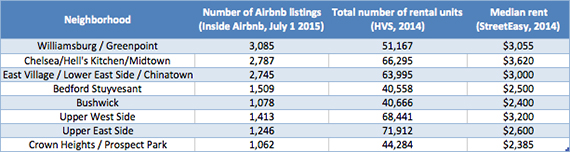
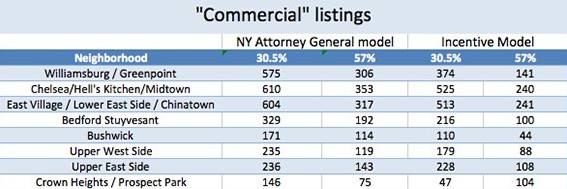
Rates are even slightly higher in the neighborhoods where Airbnb is most popular. In Williamsburg and Greenpoint, there were between 300-575 commercial listings, or 10 to 19 percent of the 3,085 total listings on Airbnb for that area. In Midtown, Chelsea and the Meatpacking District, of 2,787 listings total, between 265 to 503, or 10 to 18 percent, are commercial.
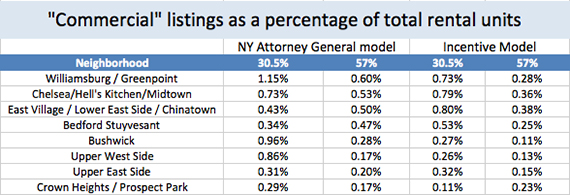
While a few hundred units may not sound like much, they’re enough to significantly impact neighborhood rents. The commercial units in Williamsburg and Greenpoint represent around 0.6 to 1.15 percent of the total rental stock in the neighborhoods, according to data from the 2014 Housing and Vacancy Survey.
Removing that percent of units will, all else being equal, elevate median rent by around 1.2 and 2.3 percent, according to broad empirical research cited by Ingrid Ellen, the director of the Urban Planning program at NYU’s Furman Center for Real Estate and Urban Policy.
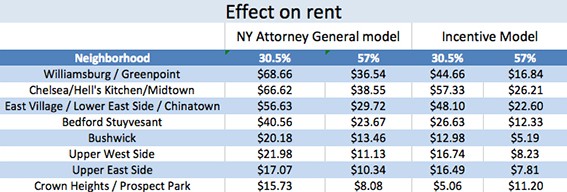
If all those units were instead on the rental market, neighborhood monthly median asking rent — $3,055, according to StreetEasy — would be around $37 to $69 lower, according to the TRD analysis.
This “Airbnb effect” is also pronounced in Midtown, Chelsea and Hell’s Kitchen. Rents in those neighborhoods would drop by around $39 to $67 a month. In the East Village, Lower East Side and Chinatown, rents would drop by about $30 to $57.
In a statement Wednesday after the story was published, Airbnb spokesperson Christopher Nulty said TRD’s report “uses bad data to make inaccurate, misleading conclusions.”
“The report mixes apples and oranges,” Nulty continued. “It wrongly assumes that renting out your spare bedroom when you’re in town and renting out an entire apartment are exactly the same thing. The truth is that Airbnb allows thousands of New Yorkers to stay in their homes and to afford living in an increasingly expensive city and 90% of NYC Airbnb hosts share the home in which they live.”
When TRD used a more conservative method of determining commercial use, the Airbnb effect was still apparent. The method, pioneered by the chief economist of the City of San Francisco and suggested by a spokesperson for Airbnb, is known as the “incentive model” and designates a unit as “commercial” when the revenue it can make in a year on Airbnb exceeds the median annual rent in the neighborhood.
In its own study, Airbnb reported citywide rent increases of only $6 per month. That study was performed by Thomas Davidoff, a professor at the Sauder School of Business, and its results were published in the Wall Street Journal in March.
Davidoff declined to explain the study’s methodology in an interview, citing an agreement with the company.
Airbnb’s desire to play down the impact that commercial users have on rents is logical. Not only do these users challenge the image of the company as a champion of the “sharing economy,” but, at least in New York, the majority of commercial listings are illegal.
While Jersey City now looks likely to legalize the service — charging a 6 percent hospitality tax — in New York, subleases for under 30 days are illegal unless the sublessor occupies the apartment. But about 60 percent of Airbnb’s commercial listings in the city are for whole units, according to the data, meaning the sublessor isn’t home.
But even if Airbnb were to suddenly become legal here, the effect on rents would remain. And while these numbers are back-of-the-envelope estimates, and many other factors affect rental supply and price, they nonetheless shed light on a hidden cost that comes with using services like Airbnb’s.
All this sharing has a price. And New York’s renters are paying it.
[vision_content_box style=”red-2″ title=”Appendix: Methodology”]
Step 1: How many days per year were units rented via Airbnb?
Airbnb doesn’t publicize rental data and has refused all requests to date, including TRD’s, to make those data available.
TRD instead used listing data “scraped” from the company’s website by Inside Airbnb, an independent data analyst.
Only listings classified as “whole unit,” that is, entire apartments, and “private room,” separate bedrooms in larger units, were considered.
They were analyzed using the San Francisco’s Office of the Legislative and Budget Analyst’s “utilization model,” which was designed to estimate the number of days a unit listed on the site was actually rented based on A) the number of user reviews it received (provided per-listing in the data); B) the number of days a listing was active, from the date it was first posted to the date of its last review C) the average length of an Airbnb stay — the company pegs the figure New York at 6.4 days — and D) an estimate of the percentage of “guests” who leave reviews.
The exact reviews-to-rentals ratio isn’t publicly available. TRD used two different approaches to approximate it:
The first estimate, 30.5 percent, is the total number of reviews on New York listings in the Inside Airbnb data between Jan. 1, 2010 to June 2, 2014 divided by the total number of bookings over the same period, according to data subpoenaed from the company by the AG last year.
The second, 57 percent, is based on Airbnb data provided to Inside Airbnb’s founder, Murray Cox, by a researcher working with Airbnb in another city. That researcher was accidentally leaked a complete dataset for that city, including rental and review totals. (TRD confirmed the ratio with the researcher, who asked to remain anonymous for fear of legal action by the company.)
Step 2: How many Airbnb listings are “commercial,” by neighborhood?
Again, there’s no objective standard for the number of days per year a unit must be rented before it counts as “commercial” and therefore off the normal rental market.
TRD used two estimates. The first was simple: 182 days, the number adopted by the AG’s office.
The second, pioneered by San Francisco’s chief economist Ted Egan and endorsed by an Airbnb spokesperson in an interview, is known as the “incentive model.” According to this method, listings are deemed commercial when the host is able to make more money by offering the unit on Airbnb than could be realized by renting it normally.
TRD estimated units’ yearly Airbnb income using the units’ per night prices, which is available in the scraped data, and the estimated number of days it was rented.
The number of commercial units in a neighborhood, on this approach, was the count of how many units there had yearly income that surpassed the neighborhood’s median monthly rent, multiplied by 12 months.
Median rent figures by sub-borough area were based on data from StreetEasy. Data from 2014 was used in order to match the total rental supply data discussed below. Asking rent was used instead of paid rent, which is unavailable.
There was one exception. The total rental unit data treated Midtown, Chelsea and the Meatpacking District as a unit, while the median rent data treated Midtown on the one hand and Chelsea and the Meatpacking District on the other as separate. Since the number of rentals in each neighborhood were unknown, the two median rent figures ($3,490 a month and $3,750 a month respectively) were simply averaged.
Step 3: What’s the effect on rent?
According to both Ellen and Davidoff, a range of empirical studies have identified a quantifiable relationship between changes in total rental inventory and changes in rent.
In New York, they said, for every 0.5 percent that rental supply contracts, rent rises by 1 percent.
So, if a rental market consists of 1,000 units with a median price of $1,000 a month, removing 50 of those units would, on average and all else being equal, increase median rent in that market by $100, to $1,100.
That ratio is, of course, citywide, and meant to evaluate the likelihood that higher or lower rents would cause residents to move out or people from other cities to move in. This rate is likely to be somewhat different at the neighborhood level.
Precise data for the rent effect at the neighborhood level doesn’t exist.
TRD used total rental market data from the 2014 Housing and Vacancy Survey, measures the number of “housing units” in the city, defined as follows:
“A housing unit may be a house, an apartment, a mobile home, a group of rooms or a single room that is occupied (or, if vacant, intended for occupancy) as separate living quarters. Separate living quarters are those in which the occupants live separately from any other individuals in the building and which have direct access from outside the building or through a common hall.”
That excludes many, though not all “private room” Airbnb listings. Data on the combined total does not exist, as they would double count some rooms.
There are some alternatives, Sean Capperis, data manager and research analyst at NYU’s Furman Center wrote in an email, such as counting the number of units with unrelated roommates and and treating each room separately. His Furman colleague Brian Karfunkel, a data analyst, suggested the possibility of counting bedrooms, or approximating an average bedroom count by neighborhood.
But data for these options is either non-existent or incomplete, and no consensus exists for how to approach them methodologically. So, while it represents a confounding factor, the plain “total unit” count was used.
These results, in general, are to be taken as a back-of-the-envelope approximation with the best-available, though far from complete, data.
Many powerful forces influence rent, from the strength of the economy, to the level of development, to zoning, and much else. Perfectly normal and uncontroversial development activities, such as condo conversions, also reduce rental supply. It’s also worth noting that higher rents incentivize more development, which would be likely to partly mitigate the supply reduction in the long run.
A clarification was added to the methodology concerning the use of Airbnb’s “private room” and “whole unit” rentals as an analogue for the Housing and Vacancy Survey’s housing units,” which largely excludes subleases and the like.
An official statement from the company was added as well.[/vision_content_box]