For New Yorkers, it’s hardly news: land prices are rising.
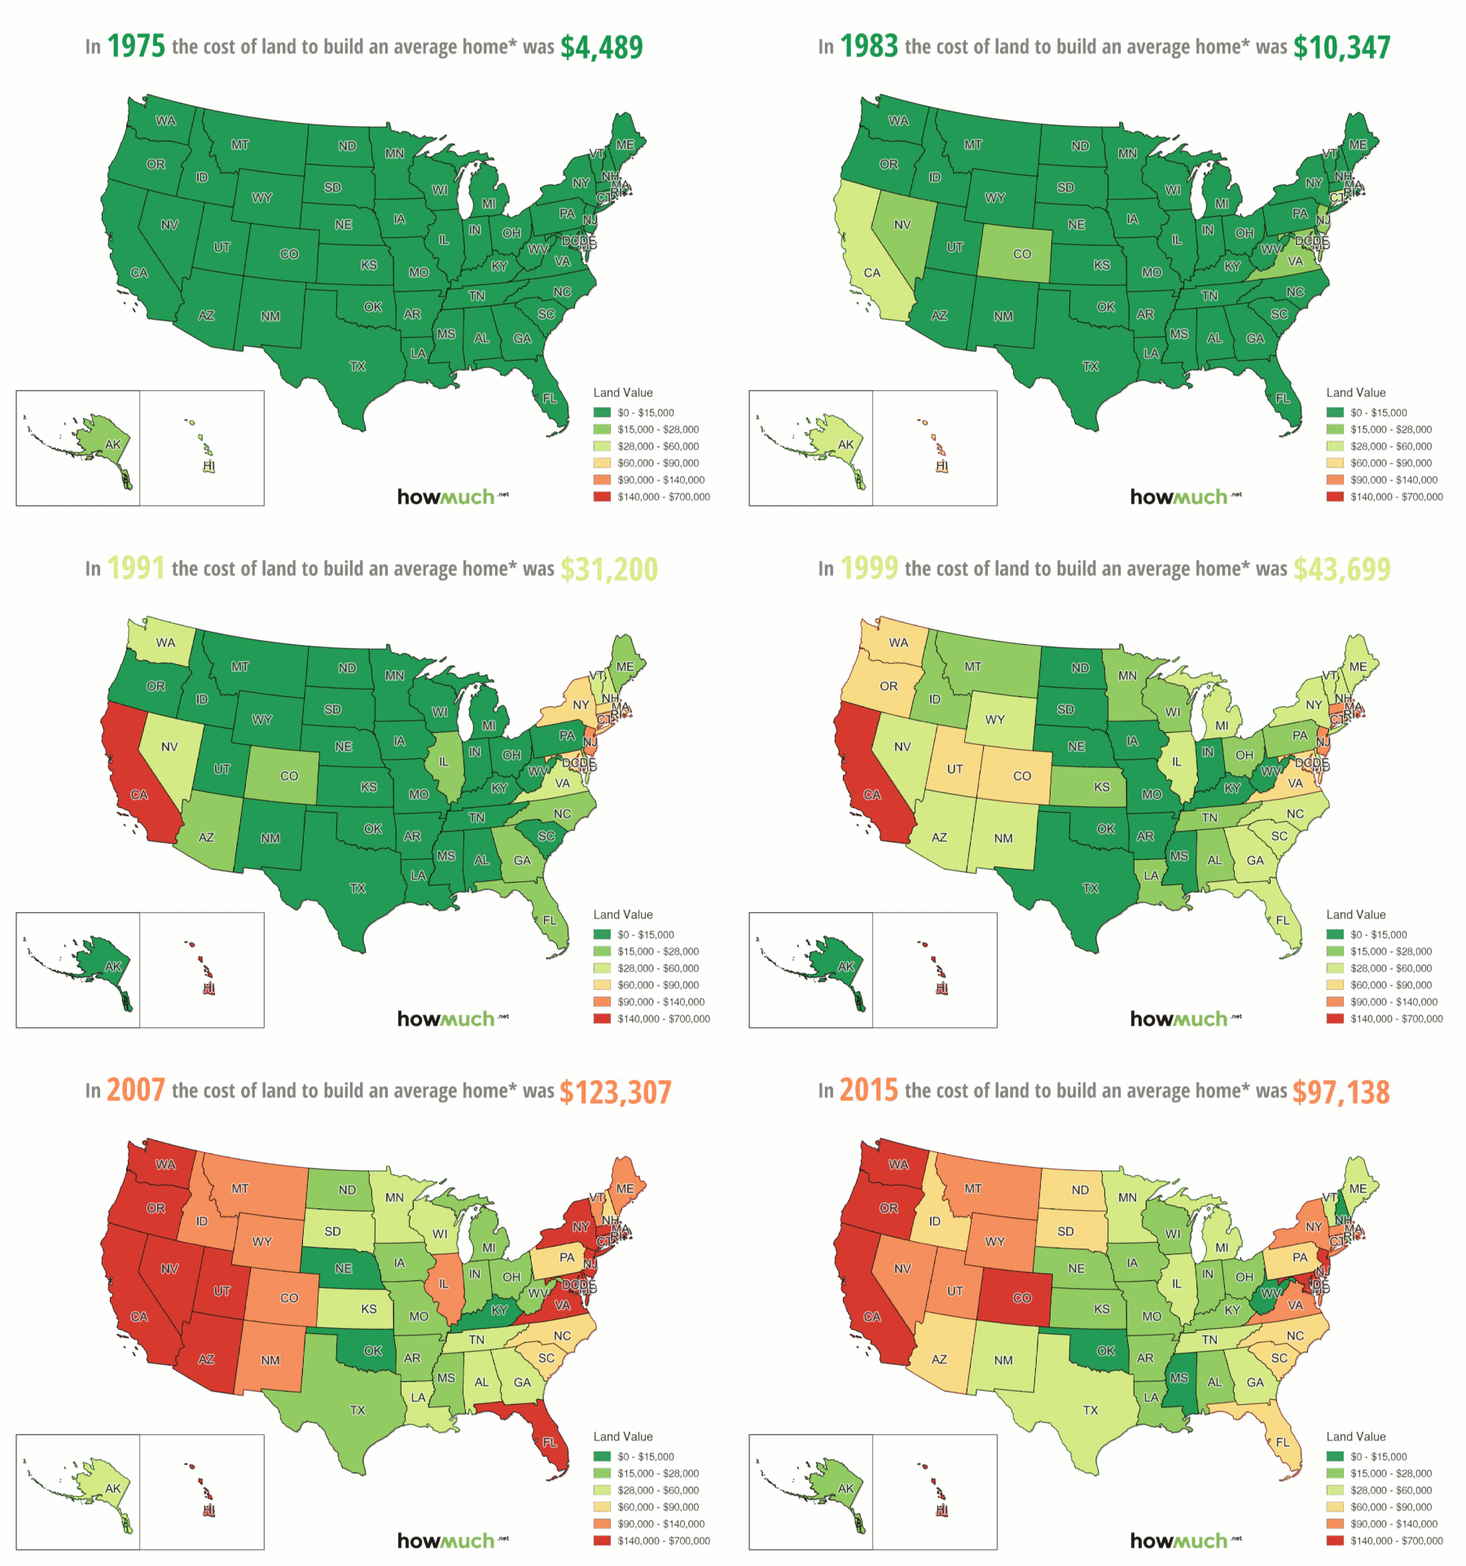
A plot of land in New York State averaged less than $3,000 in cost back 1975. These days, land in the Empire State averages $106,753. The trend has largely held true for most of the country over the past 40 years, according to an animated map by HowMuch, which uses data collected by the Lincoln Center for Land Policy.
Land prices grew rapidly between 2000 and 2007, with multiple states averaging north of $140,000. The financial crisis saw prices fall sharply between 2008 and 2011, but prices have steadily risen since 2012.
Currently, land prices in some areas of New York City reach over $800 per square foot, according to an April analysis by The Real Deal. [HowMuch] — Claire Moses
