The Manhattan condominium market is equal parts bedlam and bluster. Take the sheer volume of activity, add in global investor interest and sprinkle in brokers talking up whatever areas they happen to have listings in, and it’s easy to imagine a potential buyer crying out: “Serenity now!”
To separate the market chatter from the hard numbers, The Real Deal looked at every single condo sale in Manhattan over the last 12 months to find which neighborhoods are seeing the biggest price changes.
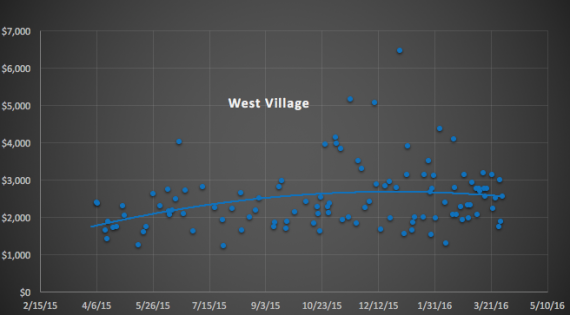
West Village condo sales by price per foot between April 2015 and March 2016, with trend lines
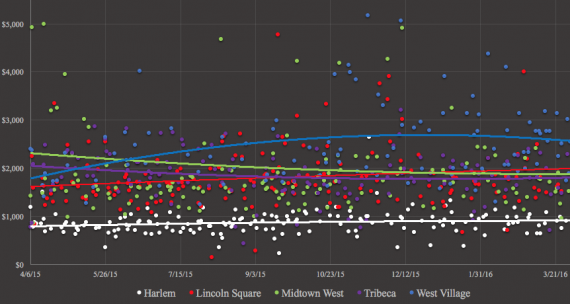
Our analysis of property records reveals that the West Village saw the steepest price appreciation, with average condo sales prices climbing roughly $700 per square foot over the past year. The average price per square foot for deals done in March 2016 was about $2,500 per square foot, compared to roughly $1,800 per foot in April 2015.
That jump was partly due to the closing of more than a dozen sales at Rudin Management’s Greenwich Lane, where prices regularly exceeded $3,000 a square foot and have crossed $5,000 a foot on at least two occasion.
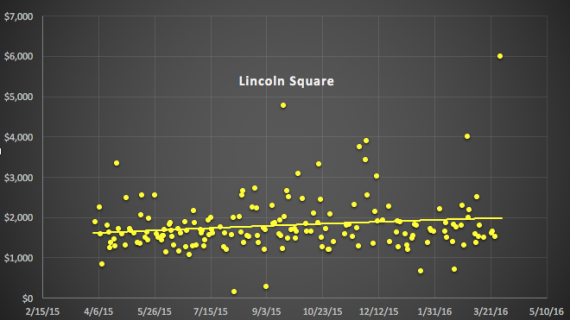
Lincoln Square condo sales by price per foot between April 2015 and March 2016, with trend lines
Central and West Harlem, along with Lincoln Square — the southern part of the Upper West Side — also saw fairly robust growth, with average sales in these pockets of Harlem rising to just over $900 per foot in March 2016 from about $775 per foot in April 2015. In Lincoln Square, pads sold for an average of $2,000 a foot in March, compared to about $1,600 per foot in April of last year.
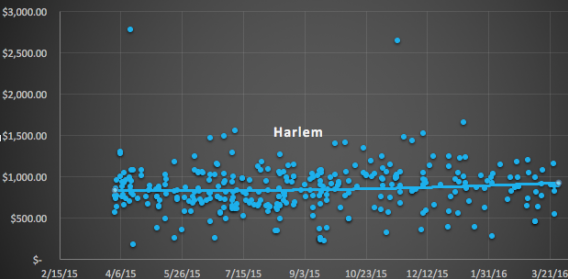
Central and West Harlem condo sales by price per foot between April 2015 and March 2016, with trend lines
In Midtown West — where multiple $15 million-plus sales at Extell Development’s One57 juiced price numbers early in the period — average sales prices fell by about $400 a foot, from $2,300 to $1,900.
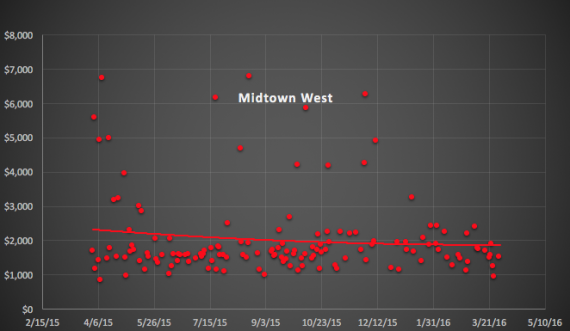
Midtown West condo sales by price per foot between April 2015 and March 2016, with trend lines
A caveat: These figures are approximations based on a single-year’s worth of data (April 2015-March 2016) that combines both very expensive and less expensive apartments, and only includes neighborhoods in which at least 100 condo transactions were recorded. The trend lines in the graphics above and below are a mathematical abstraction from the data, not the “true” price level. The analysis also excluded apartments where the recorded square footage was less than 350 square feet and those deals where the recorded sales price was under $100,000.
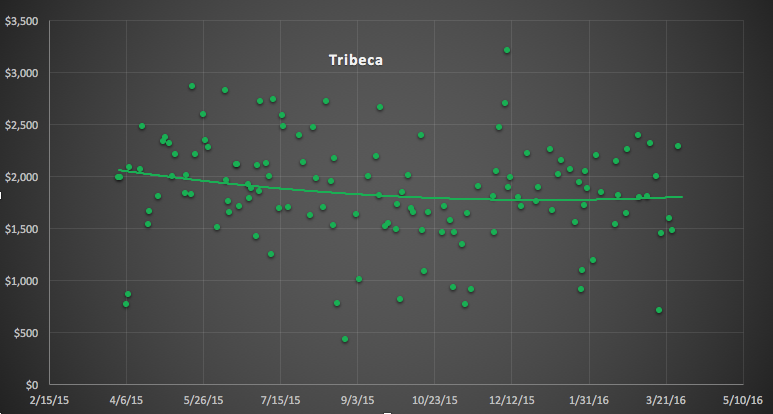
Tribeca condo sales by price per foot between April 2015 and March 2016, with trend lines
Still, a glance at actual recorded sales activity may help put paid to some long-held assumptions about the market. Take Tribeca: long the poster child for extraordinarily-priced everything, the neighborhood actually saw average sale prices fall to about $1,800 per square foot in March, down from about $2,050 in April 2015. The neighborhood had seen a significant number of deals with prices north of $2,500 per square foot late last year, including four at Matrix Development and Clarion Partners’ 7 Harrison Street.
Prices in other Manhattan neighborhoods were, on average, flatter over the period.