
After a wait of 417 calendar days, or 286 trading days, the S&P 500 finally set a new record high on light volume. Bonds have soared, and yields have dropped to ludicrous lows. The 10-year Treasury yield hit an all-time low on Friday of 1.366 percent. Globally, nearly $13 trillion, or 29 percent of total bonds outstanding, are trading with a negative yield. So those asset bubbles remain intact.
Commercial real estate has been soaring since March 2009, and that bubble remains intact, though some markets are already causing fear and trembling due to office-space gluts that are now coinciding with withering demand, such as in Houston and in San Francisco. Home prices too have been soaring for years, though in some major cities, the tide has turned.
Rents have been rising in parallel. It’s in real estate where an asset bubble becomes a real-life issue for people who don’t even own any assets – they’re paying the price for the bubble.
Other asset bubbles abound. Central banks have accomplished a lot. Blowing so many bubbles to such an extent for so long has been an astounding feat. In total, central banks created $24.6 trillion, according to BofA Merrill Lynch estimates. When they bought financial assets with that new moolah, they put $24.6 trillion of cash into the hands of investors and speculators concentrated in the major financial centers of the world.
Yet the global economy remains languid. Demand is sluggish. Job growth in the US can barely keep up with population growth. And a good part of American consumers – those on fixed incomes and savers – have seen their incomes transferred to others. So they’ve gutted their consumption.
But economic reality doesn’t matter to stocks and bonds. No one has to live in them. Economic reality matters to housing, however: the market needs to have enough people who can afford to pay the mortgage or rent. So the housing bubble is subject to another force: the reality of incomes. And those incomes have been a dreary sight for the past 16 years.
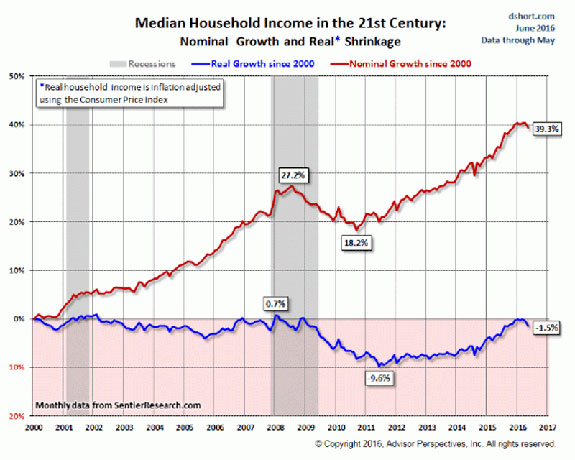
The median annual household income in May, not adjusted for inflation, fell 0.7 percent to $56,853, the second month in a row of declines, but was still up 2.9% from a year ago, according to Sentier Research, which uses Census data as base for its monthly updates. Adjusted for inflation, “real income” fell 0.9 percent for the month and rose 1.8 percent year over year, but remains 1.5 percent below where it had been in January 2000.
This chart by Doug Short at Advisor Perspectives shows the changes in nominal (red) vs. real (blue) median household incomes from January 2000. Note the sudden downturn:
In the press release, Sentier Research’s Gordon Green put the current decline in income this way:
“A cause of concern is what happens to inflation, which showed an uptick of 0.2 percent between April and May, driven by rising fuel prices. We are now at a point where the May 2016 median is 0.3 percent lower than the median of $57,024 in December 2007, the beginning month of the recession that occurred more than eight years ago, and 1.5 percent lower than the median of $57,701 in January 2000, the beginning of this statistical series.”
Kudos, central banks!
But there is a fly in the ointment: when incomes stagnate as housing costs soar, and as people can’t pay those soaring rents, something has to give. And that’s already happening in some cities, such as San Francisco. But mostly, rents are still soaring, though maybe not quite enough….
Year-over-year rent inflation in June, nationwide, was down to 3.5 percent from over 5.2 percent in June last year, laments Axiometrics, an apartment data services provider. During the glory days of 2014 and 2015, rent inflation ran over 5 percent. “But the sky isn’t falling,” it said. “The extremely high levels of 2014 and most of 2015 were not sustainable.”
Year-to-date in June, rent inflation amounted to 3.8 percent, below the post-recession June average of 4.0 percent, and down from 4.5 percent over the same period in 2014 and 4.7 percent in 2015.
This chart shows the 17 metros among the Axio Top 50 metros (based on number of apartment units) with the highest annual effective rent inflation. Note how rent inflation declined for 13 of those metros from the obscene levels in June 2015 (black bars) to the slightly less obscene levels of June 2016 (red bars). And Portland? Oops…
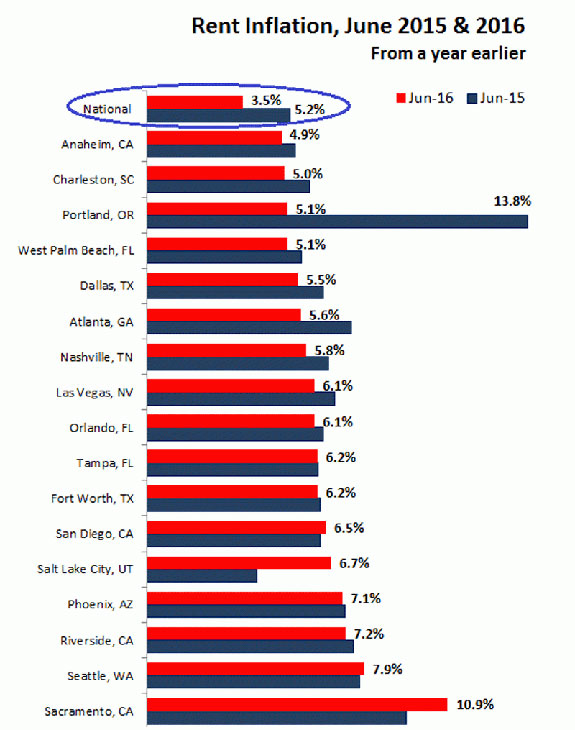
Sacramento, CA, leads the pack with 10.9 percent year-over-year rent inflation in June. But Oakland, “which spent more than a year at No. 1 in 2014 and 2015,” well, it “fell off the table.” In San Francisco, soaring rents led to the “Housing Crisis,” but a phenomenal construction boom has led to a condo and apartment glut. Rents are now stagnating, with a year-over-year increase in June of 0.5 percent. And it’s off the table. Another Bay Area hot spot, San Jose saw rent inflation drop to 1.0 percent, its “lowest rent growth since April 2010.”
According to Axiometrics, “all three Bay Area metros” – Oakland, San Francisco, and San Jose – “were among the five largest decreases.” Mercifully, Houston is not on the list either. Rents actually fell 2.1 percent in June from a year ago, as the oil bust drags on while apartment “oversupply is still an issue.”
Booming rents and cheap money over the years triggered and then nurtured a construction boom nationwide. But incomes have stagnated. And that reality is beginning to raise its ugly head.
Just when there’s a condo glut building up in the teetering housing markets of San Francisco, Manhattan, and Miami, with sales and prices already dropping, and with everyone in the industry praying for foreign investors to bail out those markets, these foreign investors are suddenly pulling back – for the first time since the Financial Crisis.