
The Real Deal‘s research division, TRData, has compiled more than 3,000 active development projects in New York City, searchable by developer, architect, size, neighborhood and borough.
For example, you may want to find out what developer filed the most residential condo units in Brooklyn over the last four years. That’s just a few clicks away.
To do that, choose the Properties tab of the Advanced Search. Click “Neighborhoods,” choose Brooklyn and check the box for “All Brooklyn.” In the field for “Filer by Date,” select “Filed AG” from the drop down menu and choose the date range “05/08/2013” to “05/08/2017.” Click “Filter” at the bottom.
The condo filings will load to show all 476 Brooklyn properties filed with the New York State Attorney General’s Office in the last four years.
To see a ranking of the developers, choose “Developer” from the drop down menu in the upper right corner and click “Rank.” A new window will pop up that allows you to rank the developers of Brooklyn property filed in the last four years by square footage and number of units. Here are a few highlights:
| Developer | Square Feet | Total Units |
|---|---|---|
| Extell Development | 1,581,561 | 500 |
| Brookland Capital | 891,024 | 177 |
| Hudson Companies | 480,871 | 267 |
The advanced search also allows you to find the most active neighborhood in Manhattan based on the amount of projects filed with the Department of Buildings in the last year.
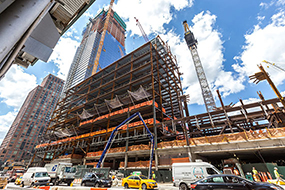
Further reading on new development in Hudson Yards
First choose the Property tab of the Advanced Search. Click “Neighborhoods” and choose “All Manhattan.” In the field for “Filter by Date,” select “Filed DOB” from the drop down and choose the date range “05/08/2016” to “05/08/2017.” Click “Filter” at the bottom.
All 174 properties filed with the DOB in the last year will be displayed.
To see the most active neighborhood, choose “Neighborhood” from the drop down menu in the upper right corner of the results page and click “Rank.” A new window will pop up that allows you to rank the neighborhoods in Manhattan by square footage of active property.
| Neighborhood | Square Feet |
|---|---|
| Hudson Yards | 2,300,000 |
| Hell's Kitchen | 962,592 |
| Greenwich Village | 567,549 |
You can also find the most active architects for Queens projects that received approval for tenant or residential use, known as the Temporary Certificate of Occupancy (TCO), in the last three years.
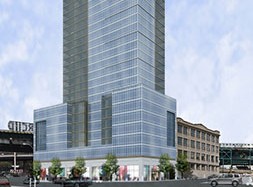
Further reading on SLCE Architect’s projects
To identify them, choose the Properties tab of the Advanced Search. Click “Neighborhoods,” choose Queens and check the box for “All Queens.” In the field for “Filter by Date,” select “Filed TCO” from the drop down and choose the date range “05/08/2014” to “05/08/2017.” Click “Filter” at the bottom.
The results yield 94 properties that received TCOs during the last three years.
To see the most active architects, choose “Architects” from the drop down menu in the upper right corner of the results page and click “Rank.” A new window will pop up that allows you to rank these architects by the number of square feet.
| Architect | Square Feet |
|---|---|
| SLCE Architects | 1,962,113 |
| MJCL Architects | 979,116 |
| SHoP Architects and Ismael Leyva Architects | 548,967 |