If you want to own the priciest listing (per square foot) in New York, a duplex penthouse at 15 Central Park West, get ready to shell out a stupefying $10,338 a foot. It’s more than twice as expensive as the priciest active listing in San Francisco, which checks in at $4,376 a square foot, according to a data analysis by research firm NeighborhoodX.
Using active listings data from appraisal firm Miller Samuel as well as regional MLS sources, NeighborhoodX crunched the numbers to determine the range and distribution of market-rate housing prices in several U.S. cities, highlighting the different dynamics at play in each market.
The analysis shows that while San Francisco can compete with New York City on average pricing, the high end of Manhattan’s luxury market is in a sphere of its own. The average asking price per square foot in Manhattan is $1,773, lower than San Francisco at $1,185 a square foot. But while San Francisco prices range from $359 to $4,376 a square foot, Manhattan prices start at $437 and end north of $10,000 a square foot.
Another crucial difference is between the Los Angeles and San Francisco markets. The two cities are neck-and-neck at the high end of the market—the highest asking price in Los Angeles checks in at $4,321 per square foot, a mere $55 difference from San Francisco—Los Angeles is a lot more affordable at the lower end of the market. The average listing in Los Angeles is $417 per square foot, almost two-thirds less than San Francisco’s, and the bottom of the market is $136 per square foot.
The low end of Manhattan’s market, by contrast, is $437 per square foot for an apartment in Inwood, which is actually more expensive than the average home in Austin, Philadelphia and New Orleans, according to the analysis.
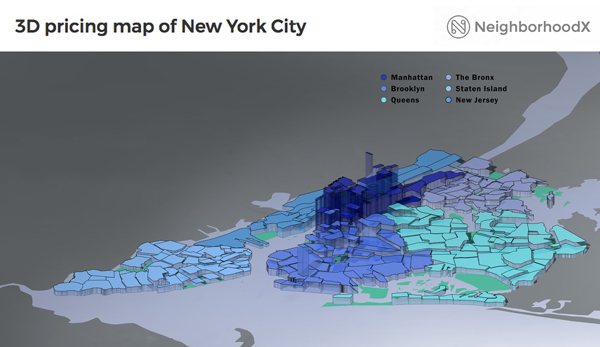
A separate analysis from NeighborhoodX illustrates the difference in price between New York neighborhoods. The shape of each neighborhood in the image below reflects the average price per square foot for that neighborhood, based on data from several sources, including Miller Samuel.