
As the national occupancy rate for hotels rose last week, thanks in part to medical workers filling guest-starved rooms and lots of empty hotels shutting down, another key metric tracked by the hospitality industry climbed: revenue per available room, or RevPar.
RevPar is a metric that allows hotel owners to see how much revenue they are generating from a property’s bookings. For the week ending April 18, the average RevPar in the U.S. rose by 5.2 percent to $17.43 from $15.61 the week prior, according to data from hospitality research firm STR. But the figure is still down 79 percent from its level a year ago because the coronavirus pandemic has decimated the travel industry.
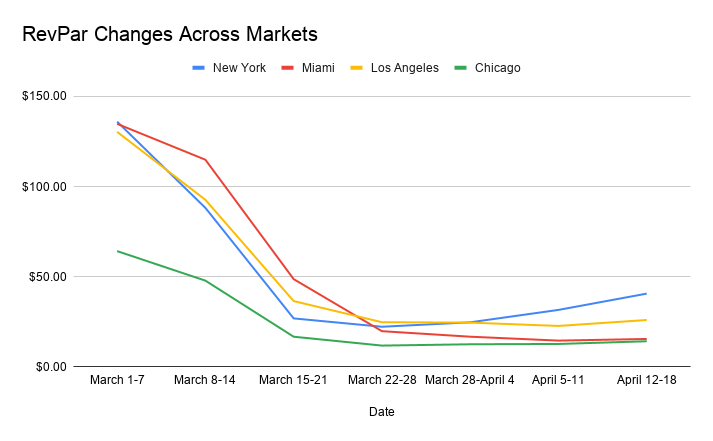
Across major markets, a similar pattern plays out. New York City recorded its lowest RevPar figure during the week of March 22, but since then the figure has steadily risen and ended last week at $40.70, according to STR. Still, that is 70 percent lower than what the city saw in the beginning of March, before the coronavirus led to mass shutdowns across the country.
The closure of virtually vacant hotels pushes RevPar up because shuttered rooms are not counted in the metric.
Chicago also experienced its lowest RevPar figure that week, of $11.88, down from $64.27 at the start of March. In that city, RevPar has inched up since then.
Miami and Los Angeles saw their low points a couple of weeks later, when RevPar tumbled to $14.64 and $22.78, respectively, the second week of April — almost 89 percent and 83 percent lower than in the first week of March. But again, RevPar in both markets closed higher in the third week of April.
RevPar in Major U.S. Cities, March through April 18
| Date | New York | Miami | Los Angeles | Chicago |
|---|---|---|---|---|
| March 1-7 | $136.05 | $134.85 | $130.41 | 64.27 |
| March 8-14 | $88.25 | $114.95 | $92.71 | $47.90 |
| March 15-21 | $26.96 | $48.74 | $36.56 | $16.80 |
| March 22-28 | 22.32 | $19.87 | $24.85 | $11.88 |
| March 28-April 4 | $24.79 | $16.81 | $24.62 | $12.61 |
| April 5-11 | $1.67 | $14.64 | $22.78 | $12.78 |
| April 12-18 | $40.70 | $15.55 | $26.07 | $14.28 |
SOURCE: STR
The occupancy rates for these markets also bumped up for the week ending April 18, according to STR, in tandem with the national average. New York last week had the highest of the four markets cited above, at 33 percent, likely because of healthcare workers occupying rooms. Meanwhile, Chicago and Miami’s occupancy rates were still below 20 percent.
Hotel Occupancy Rates in Major U.S. Cities from March through April 18
| Date | New York | Miami | Los Angeles | Chicago |
|---|---|---|---|---|
| March 1-7 | 72.1% | 77.1% | 74.8% | 56.1% |
| March 8-14 | 48.8% | 67.3% | 58.3% | 43.8% |
| March 15-21 | 16.8% | 35.0% | 29.0% | 20.4% |
| March 22-28 | 15.2% | 20.4% | 21.0% | 16.1% |
| March 28-April 4 | 18.3% | 18.3% | 21.5% | 17.1% |
| April 5-11 | 24.8% | 17.7% | 21.2% | 17.7% |
| April 12-18 | 33.3% | 18.9% | 24.4% | 19.6% |
SOURCE: STR
Write to Mary Diduch at md@therealdeal.com