Residents, commuters and tourists in New York City share the streets and sidewalks, but the buildings they own, rent, work in and shop in are worlds apart.
To better understand the range of property values in the five boroughs — as well as some of the differences within a single district — The Real Deal analyzed 16 neighborhoods, from the Upper West Side to Gravesend, Brooklyn.
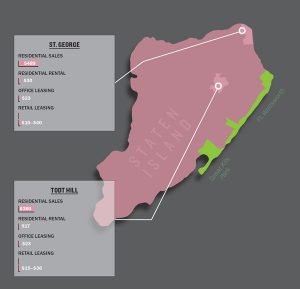
The greatest disparity was in retail. While store tenants are asked to shell out more than $4,400 per square foot along Upper Fifth Avenue in Manhattan, they can lease space for as little as $10 per foot in St. George, Staten Island.
By contrast, average office rents have the tightest range citywide — from a high of about $82 per square foot in Midtown to a low of roughly $22 in Staten Island and the Bronx.
There’s also a remarkably stable ratio between the price of buying a home and renting one in these select neighborhoods.
The rental price per foot ranges from about 3 percent to just over 6 percent of the average residential sales price in 13 of the neighborhoods. But in Parkchester and Mott Haven/Port Morris in the Bronx and in Jamaica, Queens, a renter is paying 10 to 13 percent per foot of the average sales price — an indication that sales prices are relatively lower in those neighborhoods compared to rentals.
Meanwhile, sales prices in the 16 neighborhoods ranged from a low of $183 per foot in Parkchester to more than $2,000 per foot in Midtown.

