The coronavirus crisis has pushed unemployment in the United States above 20 percent, with travel, hospitality and oil and gas among the hardest-hit industries. Metropolitan areas with higher concentrations of such jobs, largely located in the Sun Belt, appear more vulnerable to a long-term downturn.
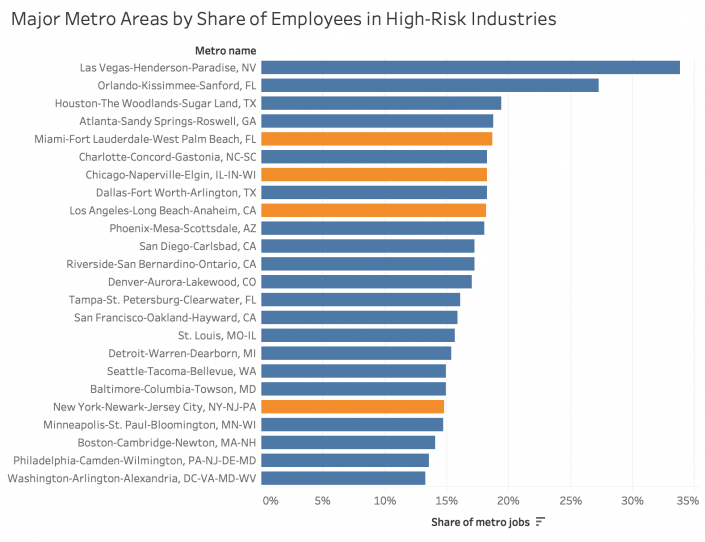
A study from the Brookings Institute in March indicated that Las Vegas and Orlando would be the two metro-area job markets most vulnerable to the coronavirus, with nearly one in three Las Vegas jobs in a high-risk industry. Oil-dependent Houston came in at No. 3.

Source: Zandi, “COVID-19: A Fiscal Stimulus,” (Moody’s Analytics, 2020) and Brookings Institute analysis of Emsi data.
Note: High risk industries include mining (NAICS 21), transportation (NAICS 48), employment services (NAICS 5613), travel arrangements (NAICS 5615), and leisure & hospitality (NAICS 71 & 72)
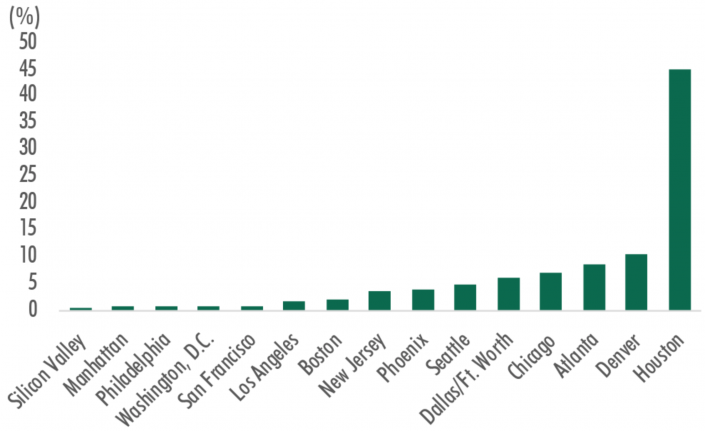
But in terms of the impact to office markets in particular, Houston is by far the most susceptible, according to a study from CBRE: More than 40 percent of office leases in that city are to companies in high-risk industries. Oil markets have continued to be roiled by uncertainty, as prices on some oil futures contracts fell below zero earlier this week for the first time in history.
Major Markets by Percentage of 2018-2019 Office Leases by Directly Impacted Industries*

Source: CBRE Research, March, 2020.
*Energy, transportation, distribution, logistics, wholesaling, warehousing/storage, hospitality, hotel, leisure, travel, fitness, airlines, manufacturers and companies that service aviation.
The Brookings data also show that job markets in the Northeast tend to be less exposed to the immediate impact of coronavirus than other parts of the country: High-risk jobs in New York, Boston, Philadelphia and Washington, D.C., all account for less than 15 percent of those cities’ overall job markets — even though New York has a robust tourism industry (it was on pace for about 67 million visits last year).
The CBRE study further suggests that office markets in Boston, Philadelphia and New Jersey have the added advantage of concentrations of healthcare, life science and retail pharmacy tenants, which are likely to experience stable demand or even growth during the public health crisis.
Major Metro Areas by Share of Employees in High-Risk Industries
| Metro name | Jobs | Share of metro jobs |
|---|---|---|
| Las Vegas-Henderson-Paradise, NV | 342,050 | 33.8% |
| Orlando-Kissimmee-Sanford, FL | 342,495 | 27.3% |
| Houston-The Woodlands-Sugar Land, TX | 583,354 | 19.4% |
| Atlanta-Sandy Springs-Roswell, GA | 498,600 | 18.8% |
| Miami-Fort Lauderdale-West Palm Beach, FL | 482,165 | 18.7% |
| Charlotte-Concord-Gastonia, NC-SC | 221,119 | 18.3% |
| Chicago-Naperville-Elgin, IL-IN-WI | 826,968 | 18.2% |
| Dallas-Fort Worth-Arlington, TX | 647,188 | 18.2% |
| Los Angeles-Long Beach-Anaheim, CA | 1,113,172 | 18.2% |
| Phoenix-Mesa-Scottsdale, AZ | 376,155 | 18.0% |
| San Diego-Carlsbad, CA | 254,258 | 17.2% |
| Riverside-San Bernardino-Ontario, CA | 260,125 | 17.2% |
| Denver-Aurora-Lakewood, CO | 255,516 | 17.1% |
| Tampa-St. Petersburg-Clearwater, FL | 208,588 | 16.1% |
| San Francisco-Oakland-Hayward, CA | 386,170 | 15.9% |
| St. Louis, MO-IL | 208,307 | 15.6% |
| Detroit-Warren-Dearborn, MI | 297,352 | 15.4% |
| Seattle-Tacoma-Bellevue, WA | 301,465 | 15.0% |
| Baltimore-Columbia-Towson, MD | 200,099 | 14.9% |
| New York-Newark-Jersey City, NY-NJ-PA | 1,359,872 | 14.8% |
| Minneapolis-St. Paul-Bloomington, MN-WI | 283,324 | 14.7% |
| Boston-Cambridge-Newton, MA-NH | 378,420 | 14.0% |
| Philadelphia-Camden-Wilmington, PA-NJ-DE-MD | 381,074 | 13.6% |
| Washington-Arlington-Alexandria, DC-VA-MD-WV | 420,015 | 13.3% |
SOURCE: Zandi, “COVID-19: A Fiscal Stimulus,” (Moody’s Analytics, 2020) and Brookings analysis of Emsi data
