In July, President Trump announced that the Department of Housing and Urban Development would repeal an Obama-era rule requiring localities that receive federal funding to break down barriers to fair housing.
“I am happy to inform all of the people living their Suburban Lifestyle Dream that you will no longer be bothered or financially hurt by having low income housing built in your neighborhood,” Trump tweeted. “Your housing prices will go up based on the market, and crime will go down.”
Though it’s too soon to see the effects of the repeal, The Real Deal used election and housing data to see how property values changed across the country over the last four years.
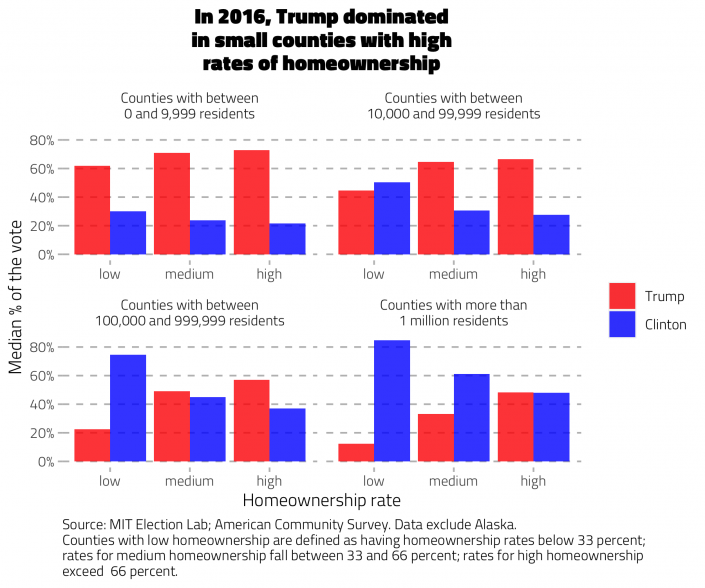
In pitching himself as a protector of the suburban way of life, Trump was playing to his base. In the 2016 election, he dominated in smaller counties with high rates of homeownership, according to an analysis of American Community Survey estimates and election data from that year.

Counties where more than 70 percent of the electorate voted for Trump saw a median increase of 19.5 percent in property values between September 2016 and September 2020, according to the Zillow Home Value Index. That’s a marginal increase over blue and purple counties.
In Shackelford County, Texas, for example, 92 percent of the electorate voted for Trump in 2016 — the highest percentage of any county for which Zillow tracks home values. There, the typical property’s value increased by 22.7 percent between September 2016 and September 2020.
Counties across the board saw a median increase in property values of 24.5 percent.
Blue counties, however, have significantly higher property values to begin with. That’s because they tend to be more populous and based around major cities like New York and San Francisco, which drives up demand and prices for real estate. Blue counties had a median value of $266,504 in September 2020, according to Zillow. Red and purple counties had a median of $119,018 and $162,453, respectively.
TRD also assessed how property values changed during previous presidential terms to see how Trump stacks up. Of the five terms analyzed, former President George W. Bush’s first term saw the steepest growth. During Bush’s first term, executive agencies eased lending restrictions, which contributed to the housing bubble that eventually burst at the tail end of Bush’s second term.
That led to a fall in housing values during former President Barack Obama’s first term, but they began to recover after he was re-elected in 2012. That recovery continued into Trump’s first term.
Source note: TRD analysis of MIT Election Lab’s county-level 2016 presidential election data and the Zillow Home Value Index. Alaska was excluded from the analysis of property values because votes in Alaska are collected at the District level and the Zillow Home Value Index does not aggregate data at the District level. Homeownership rate data came from the 2018 American Community Survey 5-year estimates, which are the most current, accurate comprehensive demographic estimates available.
