
I’m super excited, actually thrilled, to release our first market report in conjunction with The Real Deal. As I mentioned last quarter, the report write-ups with charts will appear at HousingNotes.com. We plan to publish the report in PDF format for the next report, but in the meantime, this temporary report captures all the information you need. I still plan to keep the co-op and condo analysis methodologies consistent, but I have added the Manhattan townhouse market (one-to-three families) as a new, separate addition to this 32-year, quarterly effort.

Aside: Vacation Break — For the past week I’ve been on a 2,000 mile vacation road trip and wrote this report from Detroit. Given the “auto” theme, I saw the 1977 Pontiac Firebird Trans Am Special Edition from the movie Smokey and the Bandit in Nashville but I contend my car is faster even though I don’t have a CB radio. Some of the actual film cars were reportedly 1976 Firebirds updated with 1977 front-end styling due to production timing, but they were presented on screen as 1977 Trans Am Special Editions. The Special Edition package (often referred to as the “Smokey and the Bandit” or Y82/Y84 Bandit Trans Am), featured black paint and gold “screaming chicken” hood decal.
But I digress.
Manhattan market presses higher as top strengthens

Prices pushed higher as inventory continued to fall
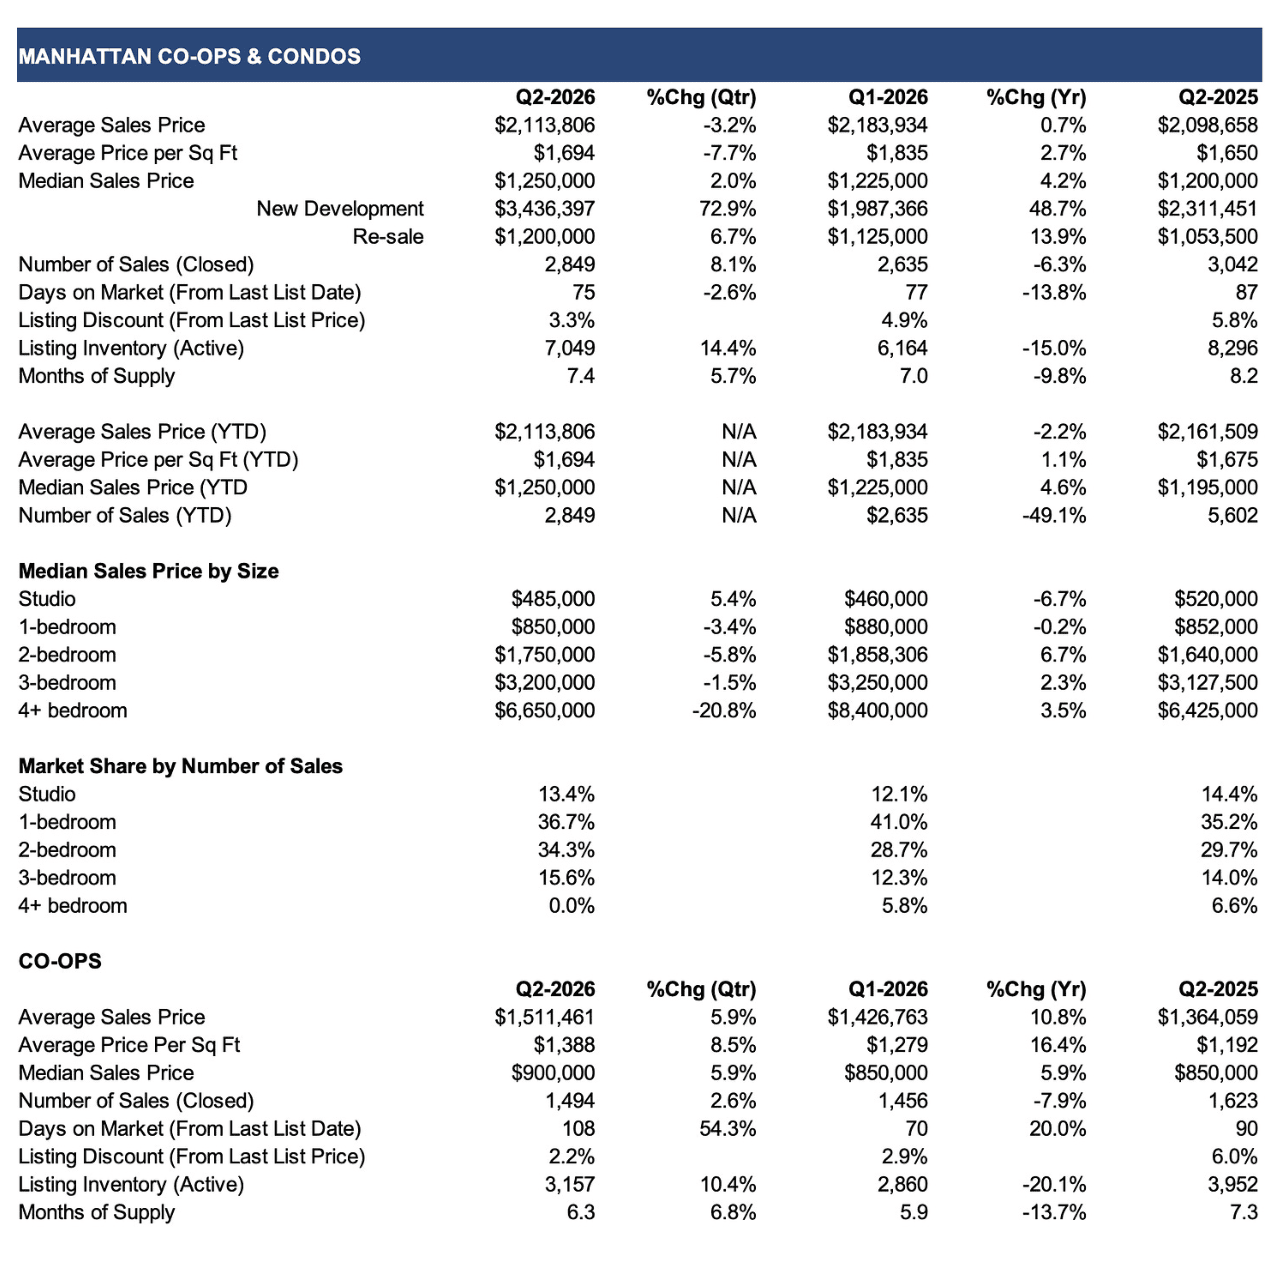
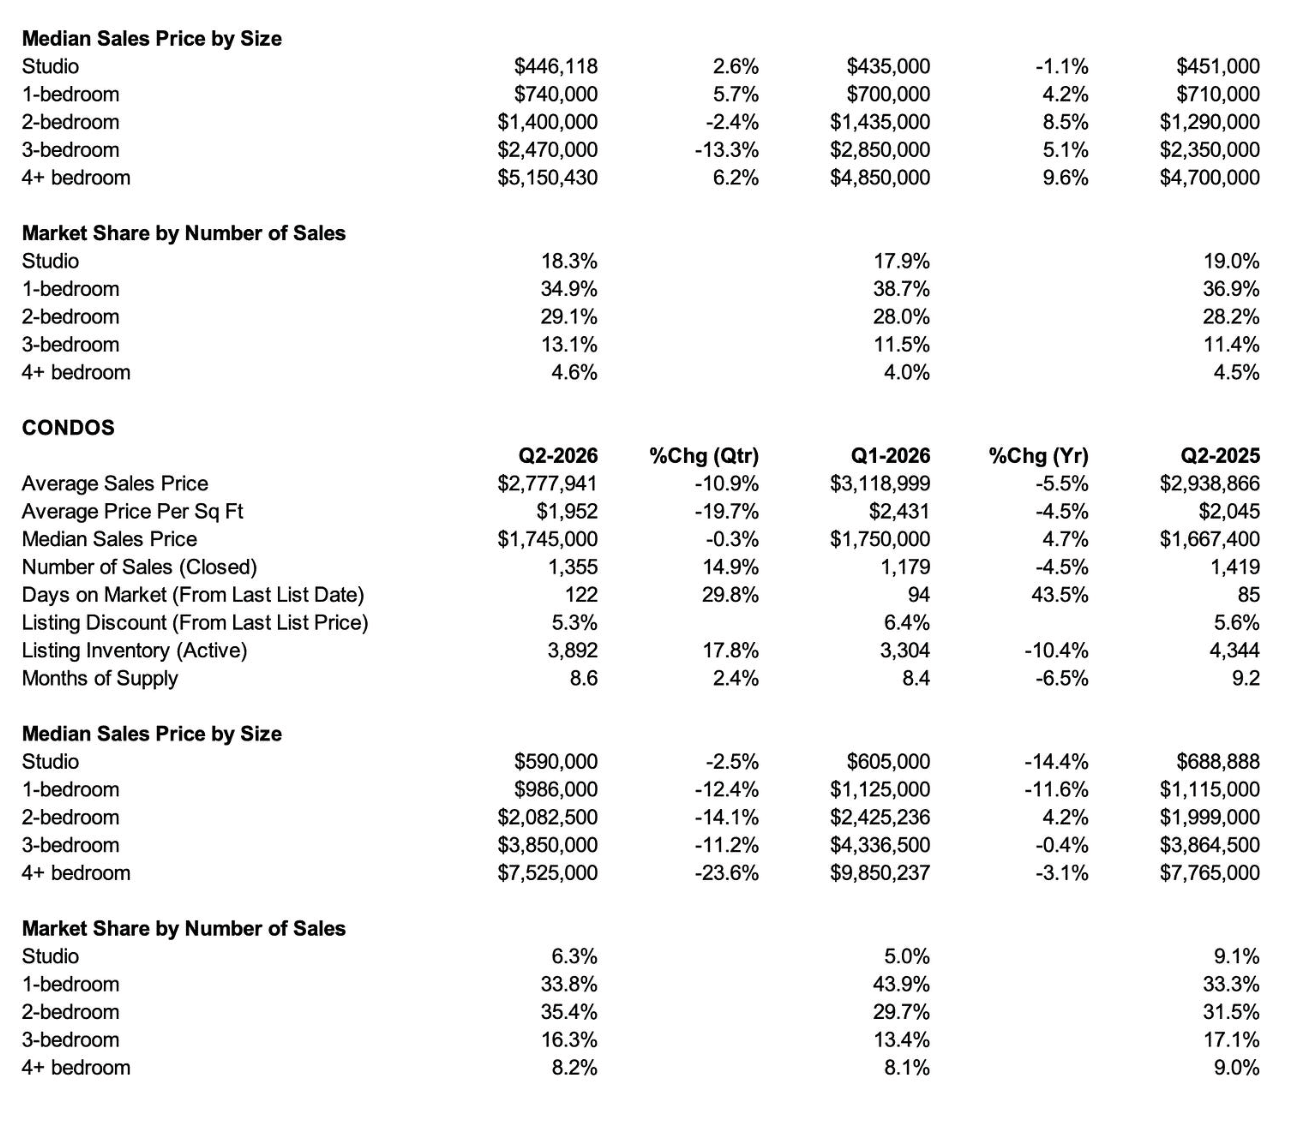
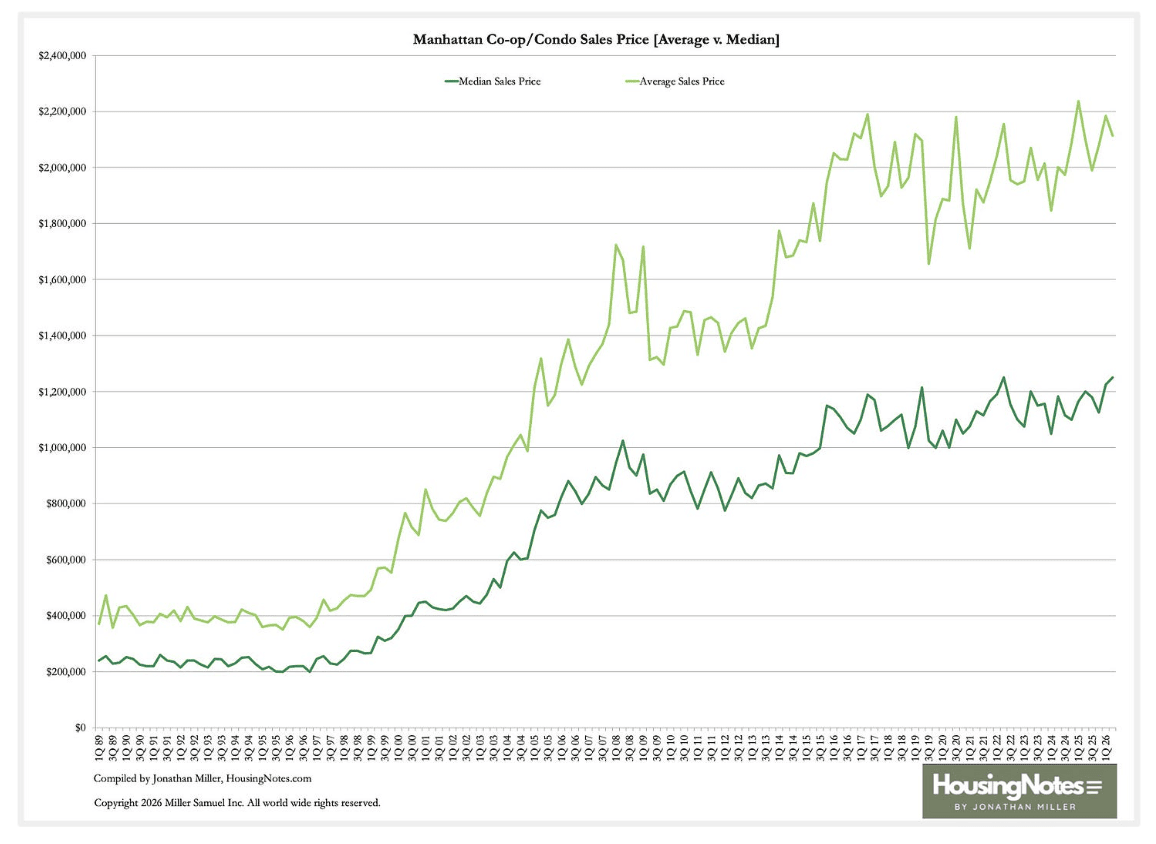
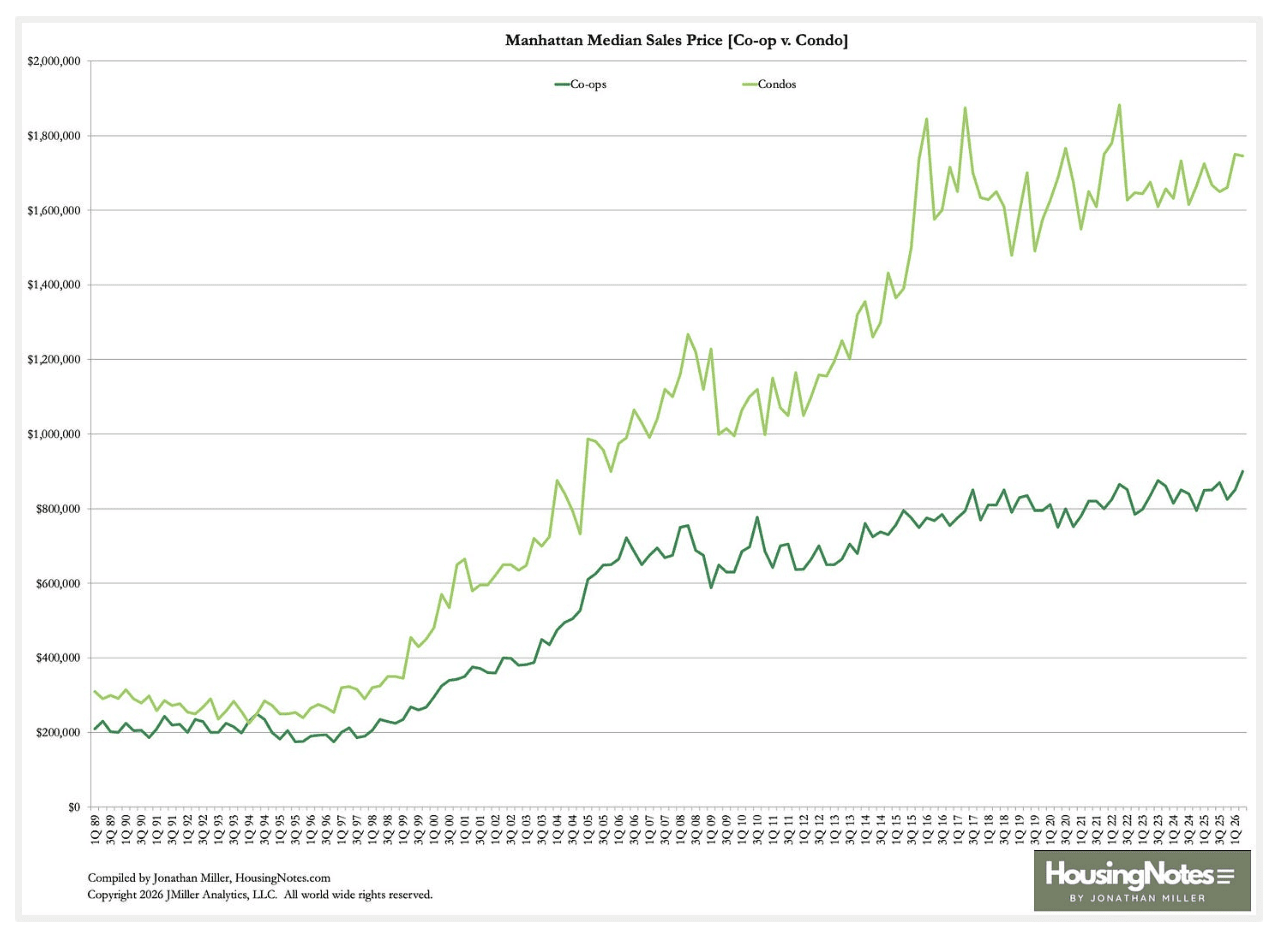
Manhattan co-op and condo prices continued to press upward year over year for the sixth straight quarter, with median sales price reaching a record high and listing inventory falling sharply. The Manhattan median sales price rose 4.2 percent annually to $1,250,000, the highest on record, tying the level set in the same quarter four years ago, a rise buoyed by heavy new-development closings. Manhattan housing prices have been steadily rising over the past 18 months, but have remained within a reasonably consistent range over the past decade. The average sales price edged up 0.7 percent year over year to $2,113,806, and the average price per square foot rose 2.7 percent to $1,694 over the same period. The market share of bidding wars was 11.9 percent, up from 7.1 percent in the same period last year. The market share of sales above the $1 million threshold was 57.9 percent of all sales, the highest share on record. The only two price tranches that showed annual sales growth were $2 million to $3 million, up 1.1 percent, and $3 million to $4 million, up 12 percent.
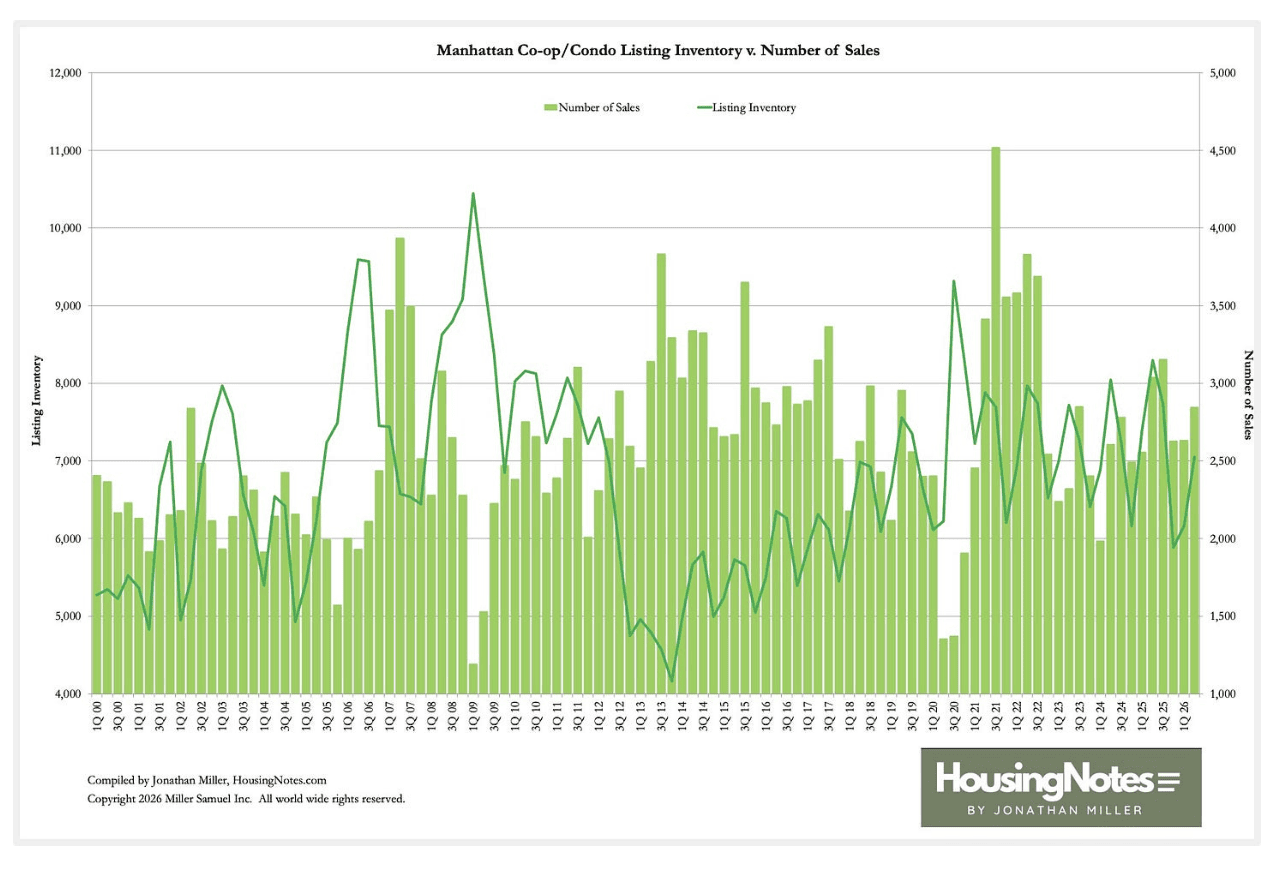
The seasonal uptick in listing inventory for the spring market was weak, falling by 15 percent year over year to 7,049. With a 50-basis point spike in mortgage rates after the start of the Iran War on February 28th, listing inventory began to compress rather than expand in preparation for the spring market. Across all size classifications, three-bedrooms fell the most year over year by 19.1 percent while one-bedrooms fell the least at 3 percent. As a result of limited listing inventory and higher mortgage rates, the number of sales slipped 6.3 percent annually to 2,849. Despite the underwhelming sales volume, the quarterly sales total was still 1.1 percent higher than the decade average for the second quarter of 2,817. The year-over-year drop in listing inventory was more pronounced for new development than for resales. Active listing inventory for new development was 445 at the end of the quarter, down 62.2 percent, reflecting a shrinking new development pipeline after 4 years of rising interest rates. In contrast, existing inventory fell a more modest 7.2 percent to 6,604 over the same period.
The monthly HOA costs continue to outpace inflation for sales that closed in the quarter. The monthly maintenance of a co-op sale was $3,077 or $2.83 per square foot, up year over year by 10.2 percent and 16 percent, respectively. The monthly condo common charge plus real estate taxes was $4,466 or $3.37 per square foot.
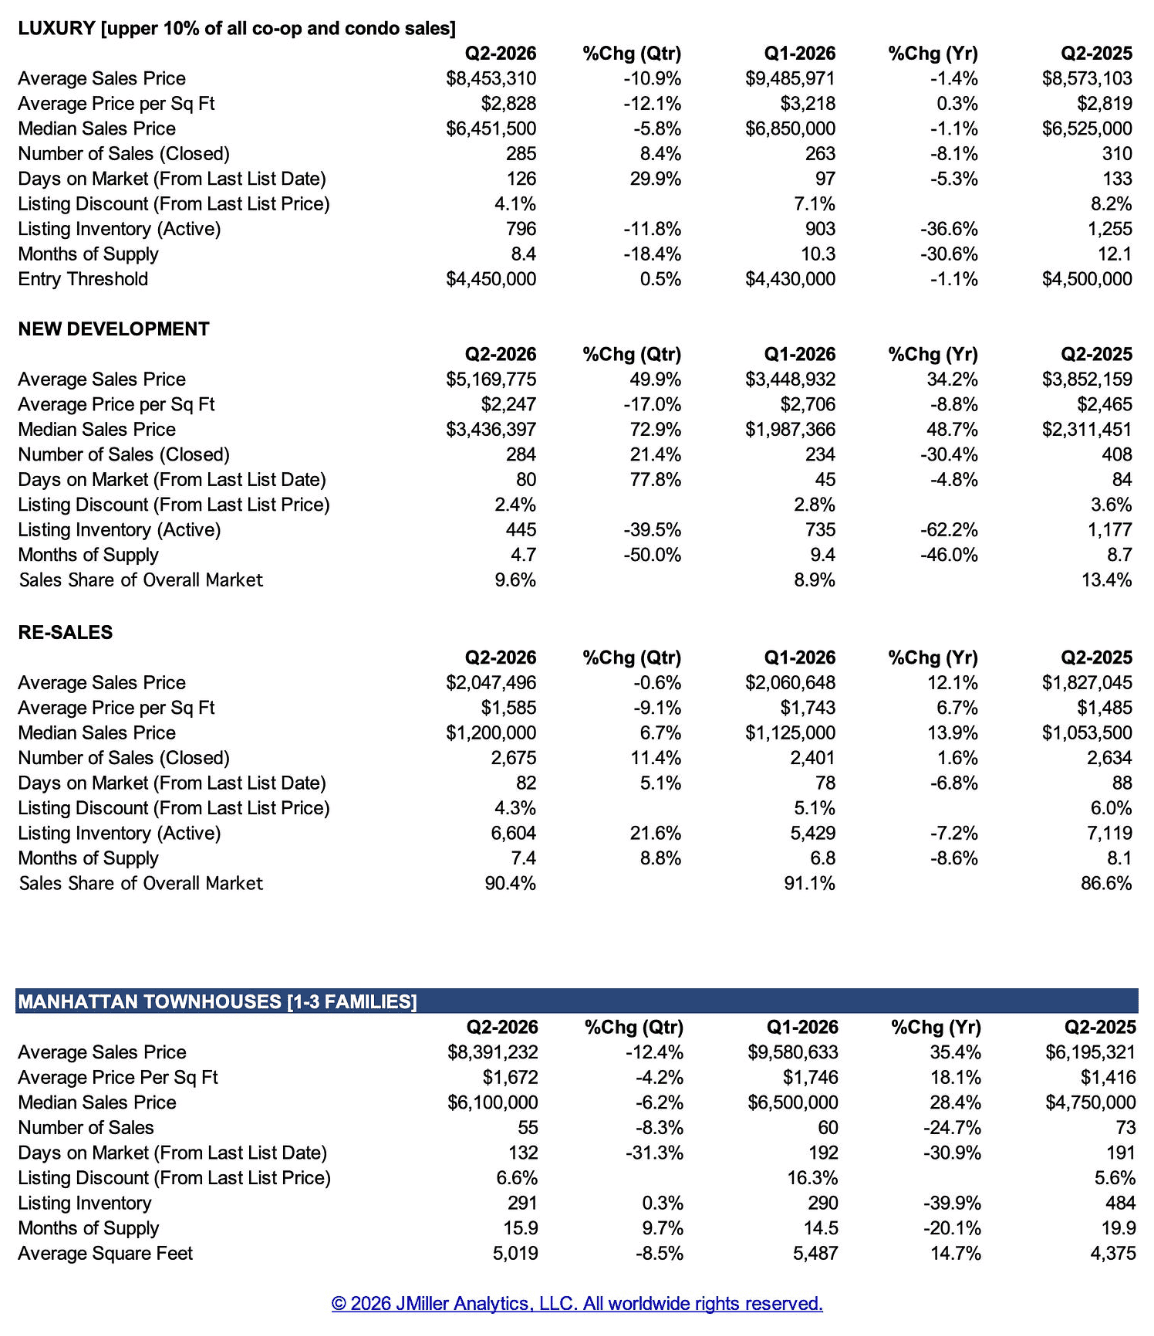
Luxury co-ops & condos see inventory plunge
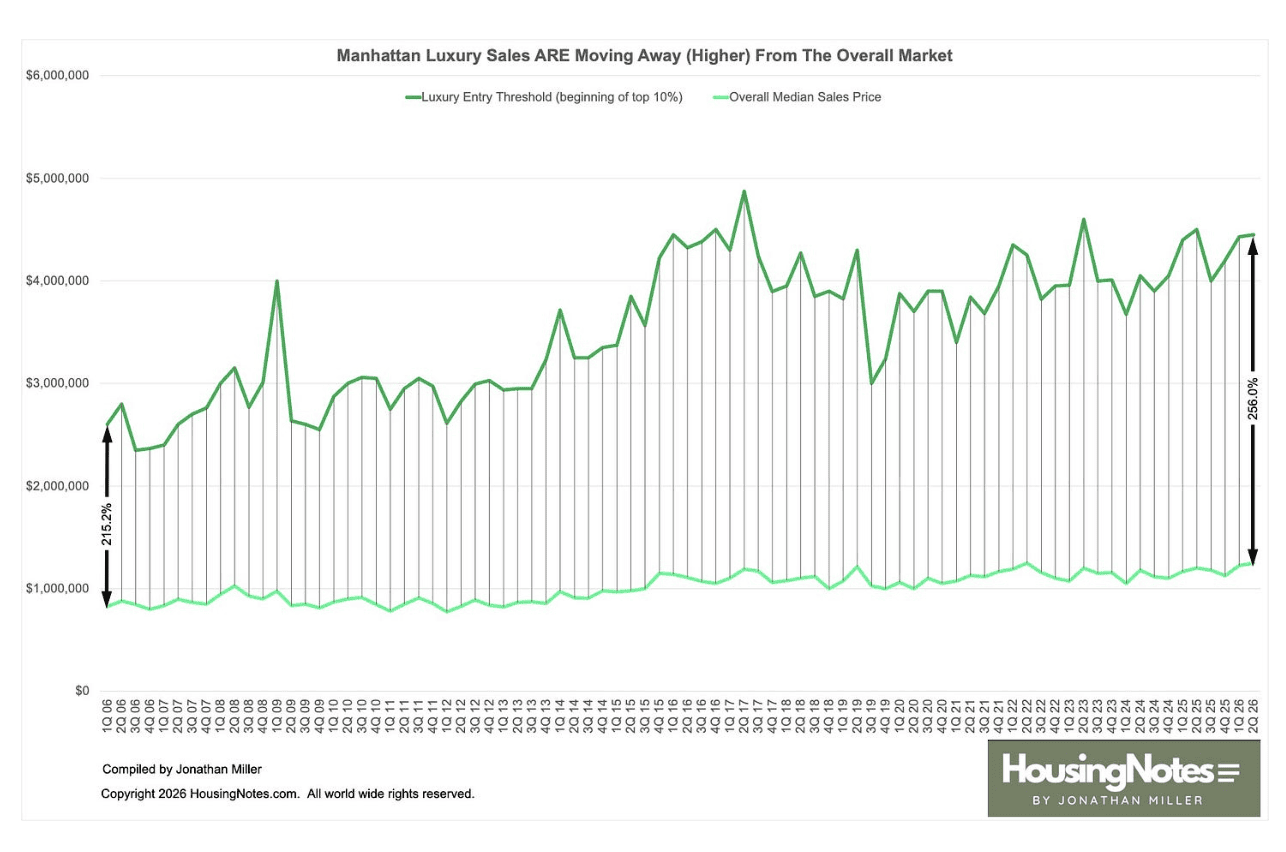
While the luxury market saw a slight decline in median sales price, listing inventory fell sharply. The median sales price was $6,451,500, down 1.1 percent annually, but so was the average sales size, down 1.7 percent to 2,989, suggesting that townhouse prices are trending to stability more than surging. The key characteristic of the luxury market, or the top 10 percent, which began at $4,450,000 this quarter, has been the collapse of listing inventory. There were 796 listings at the end of the quarter, the lowest in 22 years of recording luxury supply.
Townhouse sales skew to larger size as inventory drops
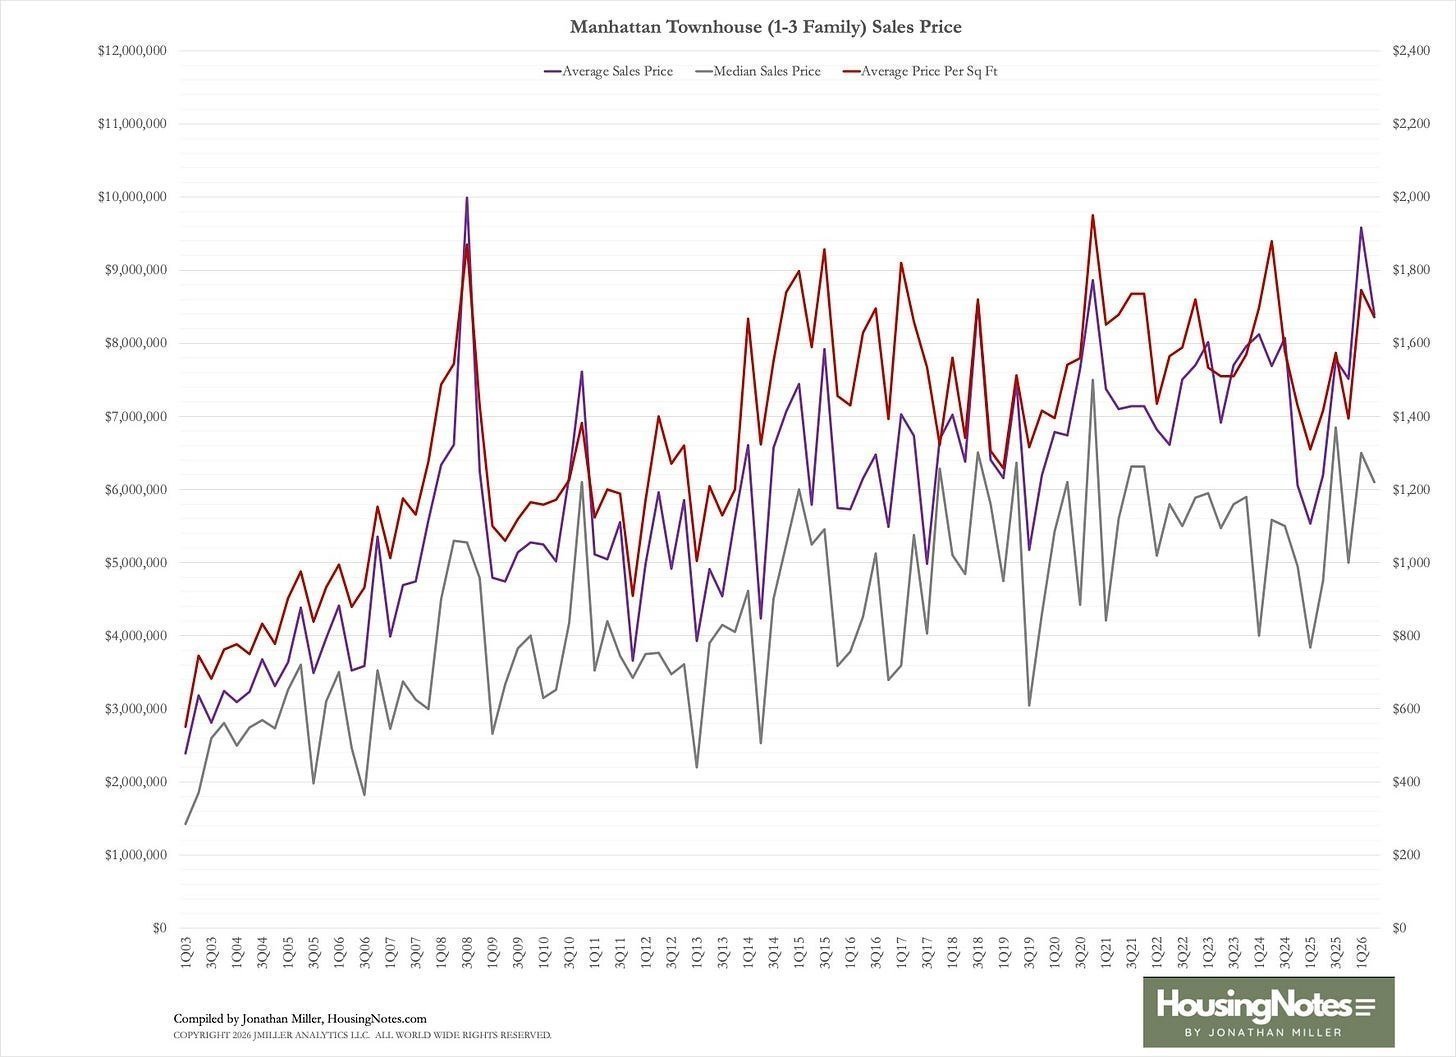
Prices of one-to-three-family townhouses surged year over year, but a large share of the price shift was due to the jump in average sales size. The average square footage of a townhouse sale was 5,019 square feet, up 14.7 percent annually, so the average price-per-square-foot increase of 18.1 percent is a more modest ±4 percent gain. The surge in median and average sales prices was partly skewed by the shift to larger sales sizes. The median price of a townhouse rose 28.4 percent annually to $6,100,000. Townhouse listing inventory corrected by 39.9 percent year over year to 291, 21.4 percent below the decade average of 370.
Final thoughts
Manhattan apartment prices reached a record median sales price of $1.25 million, but the increase is being driven more by tight supply and a shift toward higher-end sales than by strong demand. Sales declined year over year, while listing inventory fell sharply, especially in new development, making supply the dominant force supporting prices. The market continues to skew upscale, with a record share of transactions above $1 million, while activity remains weaker below that threshold, with only the $2–$4 million range showing strength. Rising mortgage rates and sharply increasing carrying costs are adding pressure on affordability, particularly for entry and mid-tier buyers. In the luxury and townhouse segments, headline price changes are largely driven by shifts in size and mix, but underlying conditions indicate a supply-constrained, stable market.
The actual final thought — Another way to think about it.
Read more Housing Notes columns and sign up for email newsletters here.
Read more

Residential
New York
Housing Notes: Breaking down the billionaire halo effect